DEEP DIVE: March heat wave shatters records – and underscores weakness of California water management
The March heat wave (that actually started at the end of February) was truly superlative, causing the steepest March snowpack decline and extraordinary early snowmelt runoff. Both rivers and water users will suffer from the heat wave’s impact on available water – but rivers will fare worse, as allocations to water users have increased despite the extraordinary dry conditions.
Across most of the Western U.S., March (and in some cases April) high temperature records were broken multiple times, and many new daily records were set. The sweltering dry month caused the meager snowpack to disappear during what is often one of the snowiest months of the year, resulting in dismal April 1st snow survey results and peak snowmelt runoff in late March instead of the more typical April-May. In some watersheds, this turns what was looking in late February to be a near-normal April-September snowmelt runoff season into one of the driest. And the heat wave is not over yet—warmer nearshore ocean temperatures leftover from the heat wave will increase California’s warmth in the coming weeks, and a likely strong El Nino will begin to impact California’s weather later this year.
Record-breaking Temperatures…
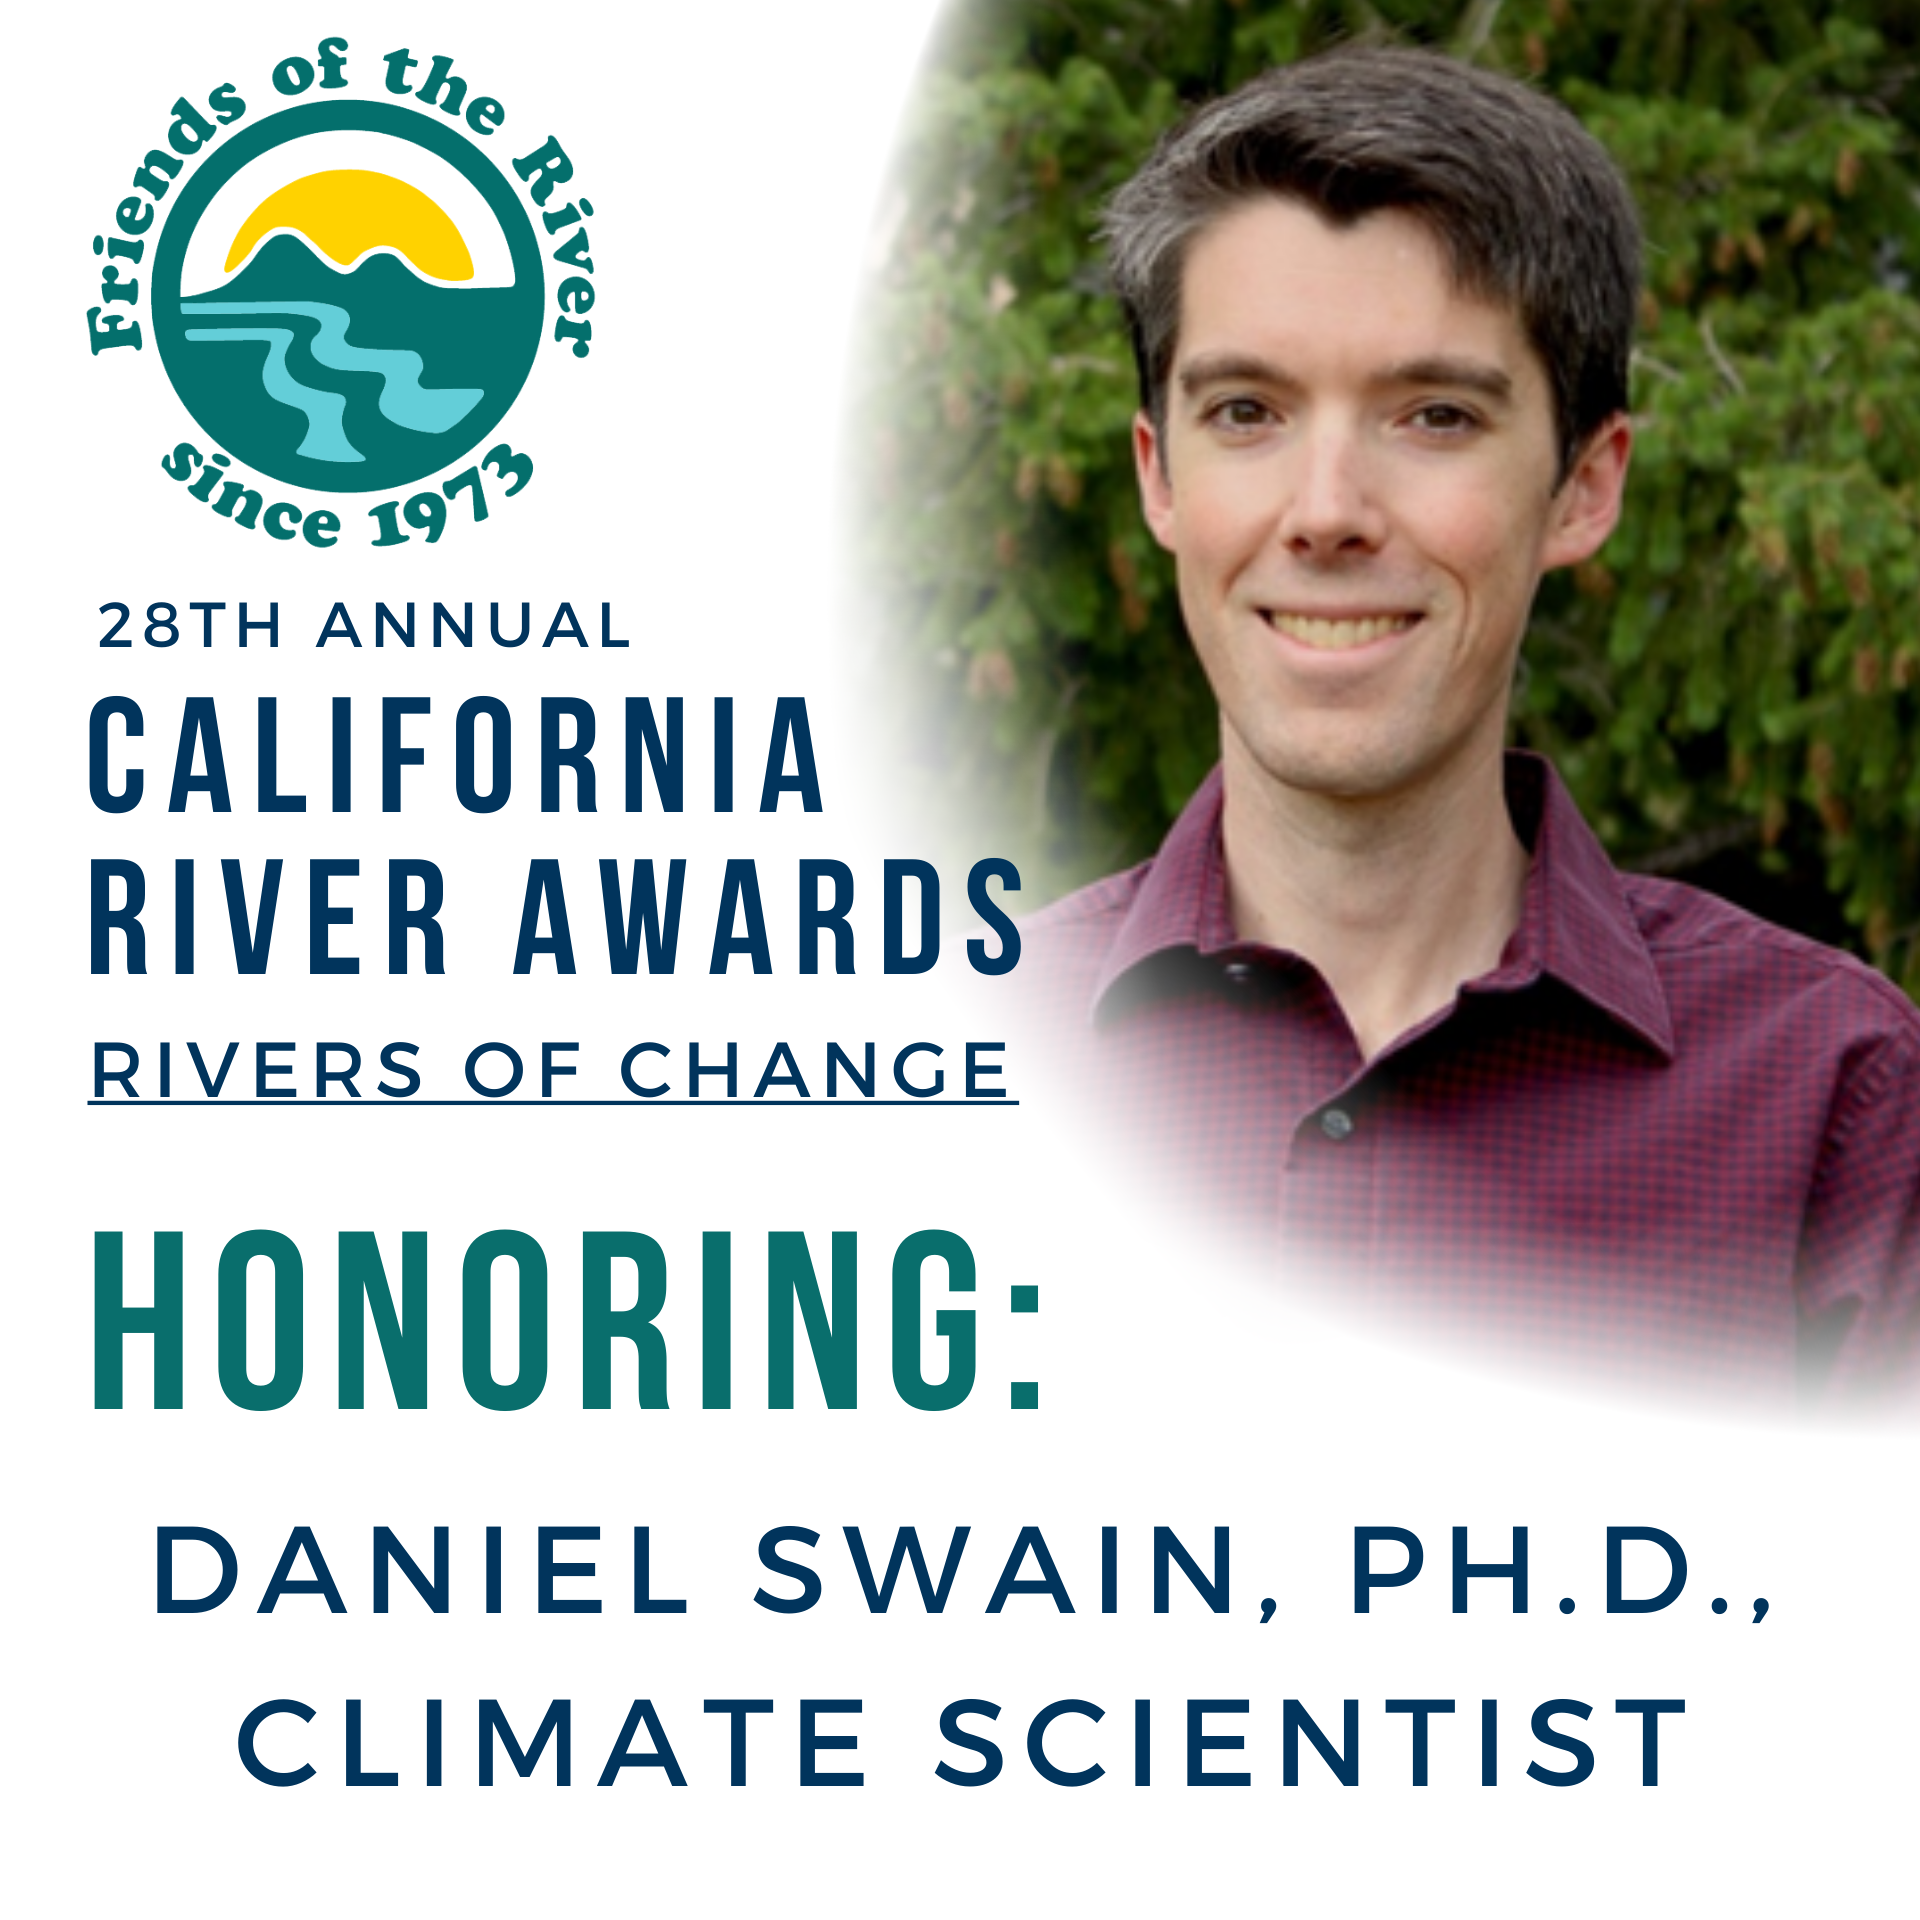
Climate scientist Dr. Daniel Swain, this year’s honoree at Friends of the River’s upcoming 2026 California River Awards, had a lot to say about the heat wave in the March 11 post to his weatherwest.com blog, and in his regular “office hours” on YouTube on March 9 and March 24. According to Swain, “this has probably turned into one of the most extreme heat anomalies in the historical record for the western and central United States… one of the most extreme heat events in an anomalous sense that we’ve observed in North America in modern history” and up there with March 2012 and June 2021.
It would be “virtually impossible without climate change” according to Swain. Unfortunately, this warm winter won’t be extraordinary much longer—it is just the first of many future years like this, thanks to our species causing the rapid warming of our planet. This winter is a reminder that the warmer future is already here, and while we adapt to the new normal we need to urgently get busy saving our climate from the worst case scenarios. (You can help by signing the petition to measure greenhouse gas emissions from dams and reservoirs and supporting FOR’s efforts to set minimum river flows and reduce water export operations that are the biggest energy use in the state(1)).
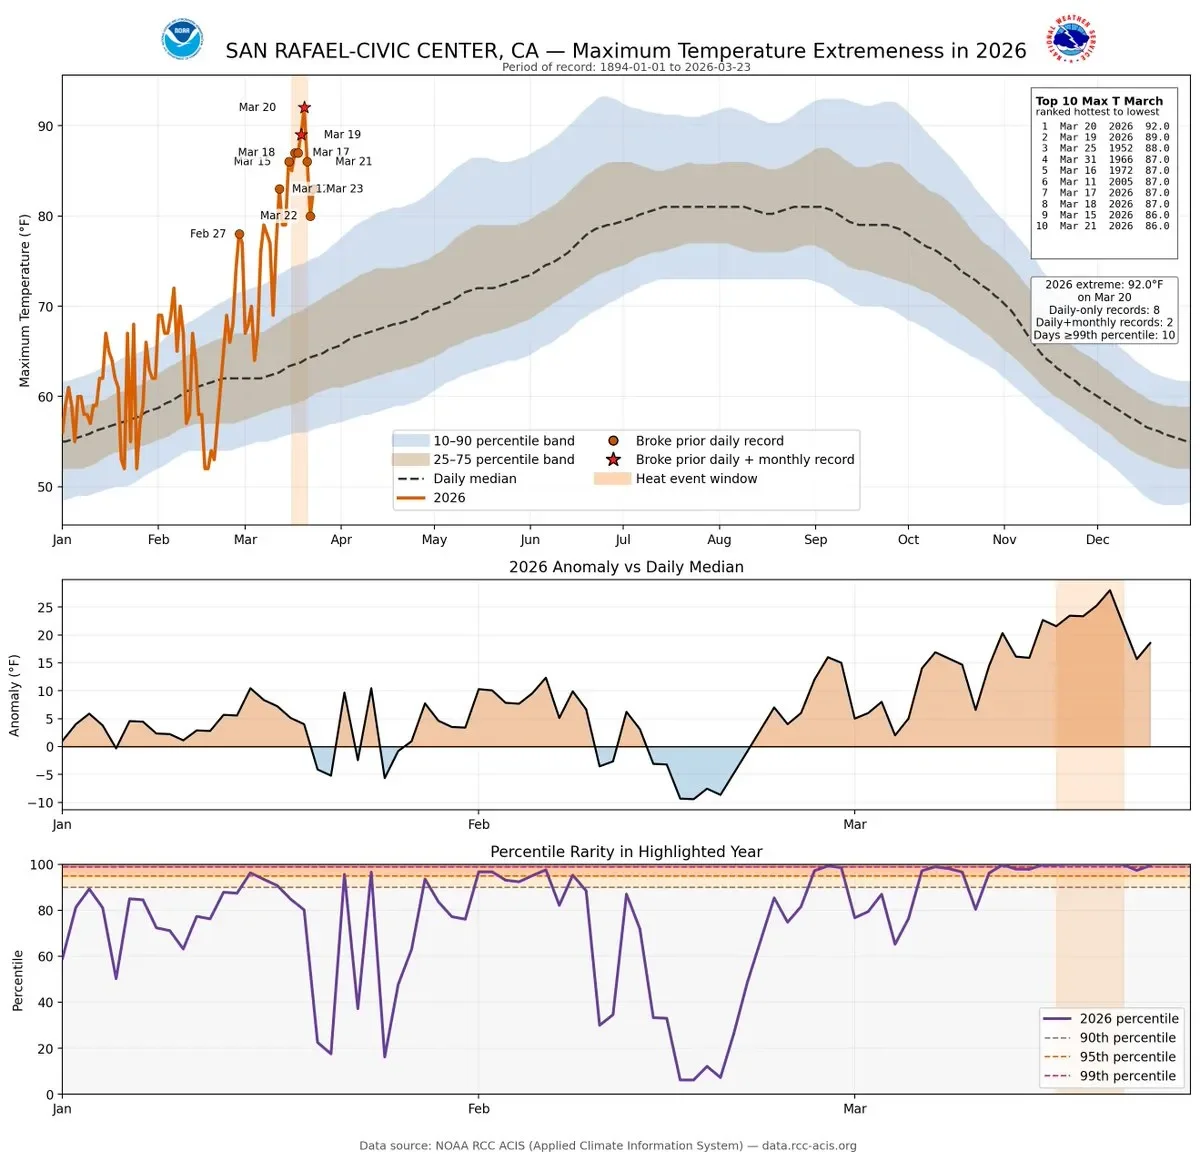
Graphs posted on March 23rd (during the heat wave) on social media by the National Weather Service, showing San Rafael daily temperatures since January: 1) The maximum temperature (top panel), 2) The temperature anomaly vs. the daily median (middle panel), and 3) The percentile (100 = a new daily record high; bottom panel). The highlighted band in the top panel identifies the same March dates with record heat as the highlighted bands in the bottom two panels.
So many March weather records were broken that we can’t list them all. Sacramento and Redding tied their all-time record-high March temperatures, and Modesto and Stockton broke theirs. Sacramento tied five daily high temperature records and broke eight. In the Bay Area, the above average March temperatures set new records for the biggest anomalies ever seen in any month at 12 out of 13 official climate monitoring stations. The 13 Bay Area sites all had the hottest March on record, and for 11 of them it was hotter than the hottest April on record. San Jose had its driest March on record. Another 22 sites in the Bay Area all had their hottest March on record, 17 of which were hotter than the hottest April, and 13 had the driest March on record.
In the Sierra Nevada mountains, some sites at nearly 7,000’ in elevation had zero March precipitation and recorded their earliest 80 degree days on record and largest number days in the 80s—as many as five days in some places—in March!
…and Record-breaking Snowmelt…
The unprecedented rapid loss of snowpack, although reminiscent of recent dry springs, set records as well: the “steepest decline ever observed in California” according to Swain. He cautioned that later in the season, we may actually underestimate streamflow because our models aren’t able to capture the dry conditions (due to “absurdly record-shattering temperatures”).
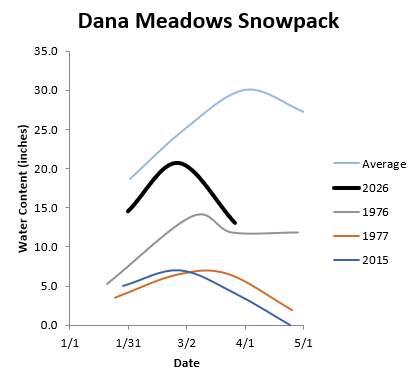
Dana Meadows snow water content in an average year and the four lowest years on record for April 1st. 2026 had a notable February rise followed by an even more remarkable March decline, peaking over a month earlier than the normal April 1st peak in snowpack.
Sierran snowpack peaked at 73% of average on February 25th. By April 1st, it had declined to only 18% of average, (second only to 5% in 2015). The snowpack at the 6,900-foot elevation Central Sierra Snow Lab almost doubled in mid-February, where they recorded 9 feet of snowfall in 5 days and which triggered California’s deadliest avalanche. Then it completely melted in March. Dana Meadows, at an elevation of 9,760 feet along the Wild and Scenic Dana Fork of the Tuolumne River near Tioga Pass, where snow survey records go back to 1926, was at 43% of average on April 1st, its fourth lowest snowpack on record after 2015, 1976, and 1977. This extraordinarily low April snowpack followed over 80% of average March 1st snowpack, which was higher than the March snowpack the last two years in a row.
At the higher elevations in the southern part of the range, snowpack was slightly better. But the lower elevations of the northern part were in single-digit percentages compared to April 1st averages—for example the Feather had 5% and American had 4%—and some watersheds had zero snow left.
…Resulting in Record Runoff
The early and intense start to the snowmelt season resulted in a peak snowmelt one to two months earlier than expected. Snowmelt will likely have a March peak in many watersheds. This usually happens in April or May.
March snowmelt at high elevations set new records. The average March flow in the Tuolumne River above Hetch Hetchy, at an elevation of 3,814 feet, was 1,241 cfs, almost double the previous record of 659 cfs set in March 2017 (records started in 2007). The San Joaquin River at Devil’s Postpile, at an elevation of 7,570 feet, had an average March flow of 241 cfs, more than double the previous record of 95 cfs set in March 2017 (records started in 2011). A station with a longer record going back to 1903 (although with several years missing 1911-1915 and 1938-1957), the West Walker River near Coleville at 5,500 feet elevation, had an average March flow of 474 cfs, beating the previous March record of 403 cfs in 1986 as well as setting several new daily records. Just pick your favorite high-elevation river, and it probably set a new monthly record as well as multiple daily records.
With all that water leaving the snowpack before April 1st, the typical peak snowpack date, many of California’s snowmelt watersheds are experiencing a reduction in April-July runoff forecasts reminiscent of 2021. The mystery of the missing runoff in 2021 was solved by researchers who determined that dry soil moisture was a large part of the reason the runoff forecast models overestimated the expected runoff, catching many water managers by surprise.
Since then, DWR has invested in additional remote sensing and modeling in many snowmelt watersheds with large water diversions, improving our knowledge of what to expect. Thanks to the Airborne Snow Observatory (ASO) LiDAR surveys combined with snowmelt models and on-the-ground density measurements, the detailed view of the Sierra snowpack we have today across many watersheds has revolutionized snowmelt runoff forecasting. For example, at the end of March, ASO estimated 421 TAF of water was in the San Joaquin River’s snowpack, 380 TAF in the Kings, 59 TAF in the Kaweah, 180 TAF in the Kern, 157 TAF in the Merced, 255 TAF in the Tuolumne, 61 TAF in the American, 41 TAF in the Yuba, 22 TAF in the Feather, 72 TAF in the Truckee, and 53 TAF in the Carson. Then the watershed snowmelt models convert this to runoff—this step is important for making the snowpack numbers useful, since in many years and places, 50% or less of that volume turns into runoff, even with additional precipitation. For example, the San Joaquin River April-July runoff with median precipitation is currently (as of mid-April) forecasted at 783 TAF, 63% of average; but with 10-percentile precipitation during those months, it is only 693 TAF, just 56% of average. A wet start to April improved these numbers about 10 percentage points.
Unfortunately there are gaps, and DWR is leaving some less-diverted watersheds with priority restoration projects ignored by these new technologies. A silver lining this year is that this year’s loss of snowpack occurred earlier than in 2021, in time for the in-person April snow surveys to measure it, and low soil moisture and low reservoirs aren’t playing the significant role they played in 2021. But to keep up with the increasing frequency of never-before-seen extremes, we need to continue to rely less on statistical models based on the past and invest in the latest remote sensing and modeling in all snowmelt watersheds, not just the ones heavily tapped by water users. And we may need to redefine California’s snowmelt runoff season to start on March 1st instead of April 1st.
Ecological Impacts
To begin with, the fire season will start earlier. The loss of snow cover in the mountains means an early start to the dry season, early loss of soil moisture, already drying fuels, water-stressed vegetation, and a longer fire season. These dry conditions, when combined with last year’s cuts to federal firefighting personnel, could bode ill for this summer’s fire season. Interestingly, because of the low sun angle in March, north-facing slopes did not melt as dramatically as south and west-facing slopes, meaning high-elevation north aspects could be spared many of the lingering negative effects of the March heat wave.
Creek and river flows will run lower and warmer this spring and summer, looking more like a dry year even in areas that had above-average winter precipitation. It is up for debate and for temperature modelers to figure out whether the large input of cold March snowmelt into reservoirs will be a positive for cold water pools used to sustain salmon through the summer and fall below dams, or whether the warm March temperatures warmed the surface waters enough to counteract the cold inputs and result in a scarcity of cold water for reservoir releases this summer and fall.
Shasta Reservoir modeling is already showing low water levels this fall that might increase the temperature-dependent mortality of salmon. The ugly reality is that senior water rights holders on the Sacramento River will get 100% of their contracted water deliveries from Shasta this year, and may even sell a portion of the water they don’t need that could have instead been used to keep the reservoir level higher, and thus the river downstream cooler (salmon need cold water). Minimal April pulse flows that benefit outmigrating salmon survival—equivalent to 1.7% of their annual allocation, and about two years of their surplus water sales—are likely to be curtailed instead to ostensibly save cold water for later (but more accurately subsidize full deliveries).
Instead of requiring all water users to keep reservoir storage and river flows higher, as the best available science clearly shows is needed, the body responsible for protecting water quality, the State Water Resources Control Board, is poised to adopt voluntary agreements (HRL for short) that require little or no increases of freshwater flow in rivers and the Bay-Delta estuary and will do little or nothing to halt or reverse the slide toward species extinctions and ecosystem collapse. HRL-ing toward extinction. The Trump Administration’s 2025 executive orders mandating maximum deliveries to entities holding contracts for federal water are also putting a thumb on the scale, further reducing this year’s anemic flows to, through and from the Delta to San Francisco Bay. You can help push back against bad water management decisions by supporting FOR’s legal and policy efforts to secure stronger water quality and endangered species protections and seek consequences for water project operators who violate the rules.
Water Supply Impacts
The warm and wet winter has left California reservoirs as full as they are allowed to be given the spaces reserved for flood control. Without much snowpack left in April, however, water users that depend on the later timing of snowmelt runoff will feel impacts. The water supply impact of this near-normal-turned-dry water year will be greater than precipitation or runoff numbers might suggest. In his March 28th weatherwest.com blog, Dr. Swain wrote “there will be a historic divergence between spring reservoir levels and their likely rapid draw-down later in the season due to lack of new snowmelt-derived inflows beginning as soon as late April and likely continuing until the beginning of the next rainy season.” Until February, much of the first half of the October 1, 2025-September 30, 2026 water year was relatively wet in much of California; in the snow-fed watersheds the second half won’t look at all like it belongs with the first half.
The impacts to state supplies extend beyond our borders: Southern California’s water sources include the Colorado River, whose Rocky Mountain snowpack is only 23% of average. Fortunately, Southern California’s prudent investments in local sustainable water supplies have made it more drought resilient than ever, and long-term trends of lowering total and imported water use are likely to continue, rendering expensive new water diversion and dam projects unnecessary, and freeing up more water that can be returned to our water-starved rivers. FOR is urging the Metropolitan Water District of Southern California and its partners to expand its pilot programs to reuse and recycle local water supplies.
While urban areas are learning to manage more sustainably, agricultural irrigators are not adapting as quickly or in some cases at all. Indeed, when it’s dry some rivers like the lower Merced, the mainstem San Joaquin, and the lower Kern can dry up completely due to excessive agricultural water diversions – and that’s a strong possibility for some of these rivers in 2026. To make matters worse, water suppliers are facilitating unsustainable water management in their allocation decisions. Recently, the Bureau of Reclamation, which operates the largest water project in California, the federal Central Valley Project, actually increased water allocations to its south of Delta agricultural contractors, despite the likelihood that water conditions will quickly deteriorate. You can help change the status quo by supporting FOR’s efforts to set and enforce minimum streamflow requirements in overallocated rivers and to reform how water projects allocate water to their contractors.
Daniel Swain to Speak at California River Awards
Learn more about the heat wave and climate crisis from Dr. Swain at our California River Awards on April 24th, where he will be honored for his climate science work and for helping all of us understand and cope with never-before-seen weather extremes. Hurry and get your tickets—they are not available much longer--at California River Awards | Friends of the River.
Resources
(1) State Water Project Energy Roadmap, p. 14